Your metrics belong in a system

Being good at SQL, data visualisation and extracting insights is like being good at navigating with a map. The thing is, someone needs to make the map in the first place - a system of metrics - and that's a totally different skill. It's something you rarely get exposed to because in established companies, a system is usually already in place. It also doesn't help that there's lots of content on defining some north star, but not so much on defining a group of metrics to capture your business as a whole.
So when you're a newbie - who isn't an analyst - it can be disorienting to make sense of it all.
Problems with a naive approach
I'd wager that most folks start naively. You care about user or revenue growth, and perhaps knowing if you are default alive or dead. That's a good start, but these are output metrics. They aren't actionable on their own and you need more granularity to investigate why growth is the way it is.
So you start looking at things that are interesting or feel obviously important - daily active, daily uninstalls, monthly active, retention curves, power user curves and so on. Not too far in, things get messy.
1. Premature focus creates blindspots
It's dangerous to bring tight focus to a small number of metrics, before you have full view of the business. You could be stuck with implicit assumptions, but have no way of challenging them. There could be a grave problem or big opportunity outside your observed view.
A cautionary tale about this is covered by Casey Winters in this post. Both GrubHub and Seamless do food delivery. Seamless equated revenue for Gross Merchandise Volume (order size and number of orders), while GrubHub viewed revenue as GMV multiplied by the average commission. A subtle difference to include "commission" in the system drastically changed how the two companies optimised for revenue. For example, while Seamless search results sorted restaurants in alphabetical order, GrubHub sorted them in order of commission earned. When the two businesses eventually merged, Casey recalls that "this was one of the first changes that was made to the Seamless model as it would drastically increase revenue...even though it didn’t affect GMV".
Similarly, say you read this classic Superhuman post and decide to track retention for a tight cohort of users. Even if you decide to ignore all other users, you need a system in place that acknowledges these ignored users and spells out your assumptions explicitly. Your assumptions to bring focus could be wrong, there could be some hidden problem (e.g. you need to drastically improve the quality of acquisition), things could change with time (e.g. your ignored users become a good fit) and so on.
2. It's confusing to have lots of metrics
If you just come up with the most intuitive set of metrics for each particular context, things can get confusing. You can end up with many similar things measured slightly differently, and no clear sense of how things relate. For example, you could be looking at churn rate and Month on Month engagement for one feature, but Week 4 retention and Week on Week engagement for another.
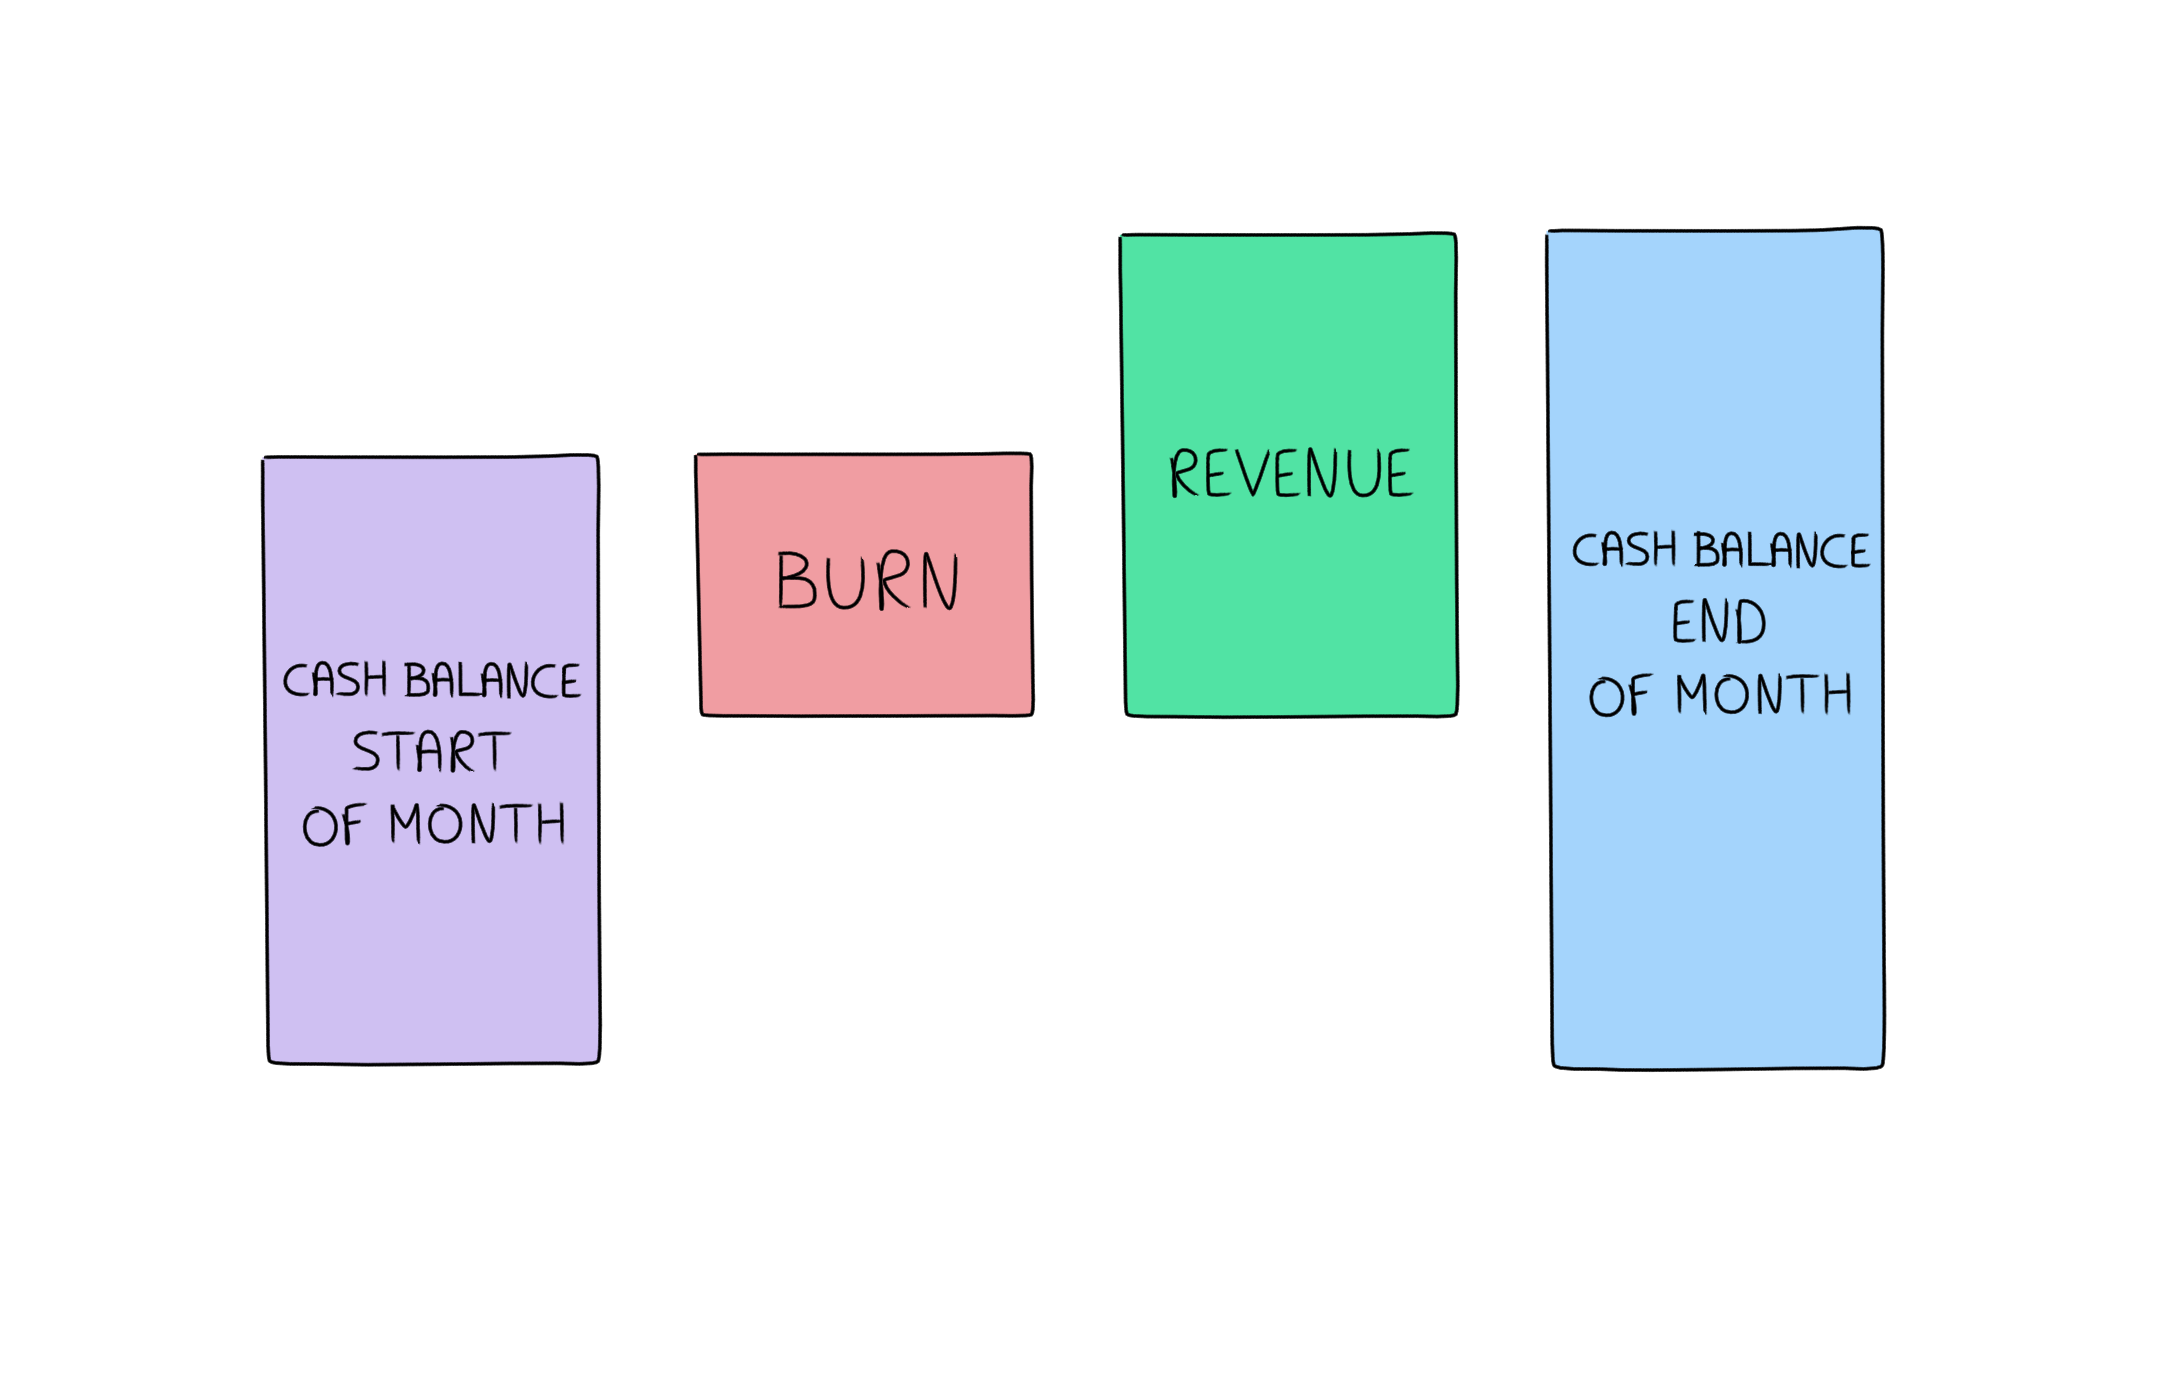
Without the guidance of a global system, local definitions will keep piling and complexity will compound. For example, fundraising will introduce concepts like burn and cash balance, which could be tracked differently to revenue.
3. Non obvious definitions introduce mental burden
While some arbitrary definitions are unavoidable, each time you do this, you introduce some recall for your team and future you, and this can be quite disruptive. Things can make total sense in context, but not when you zoom out or come back later.
For instance, in eesel, "disabled" users were users not seen for 30 days. Even if we knew this by heart, we would still have some friction when looking at a visualisation of "daily disabled" - "ah this is a laggy metric", "ah it's 30 days not 28 days".
Build a system of metrics
It's hopefully clear by now that before diving into numbers, you need to step back and come up with a holistic system. You need to map your terrain, before you figure out your path.
Step 1. Understand Growth Accounting
A metric moves from one point to another, over a period of time, because some things add to it, and some things subtract from it. There is no other reason for it to move. Growth Accounting is about breaking down the different components that cause a move.

In that vein, the growth rate for a metric is the following.

Growth Accounting is a simple and obvious concept, but everything comes back to it. The magic is that you can apply it to any metric - whether it's active users, engaged users, burn, revenue.
Step 2. Figure out your core metrics
Establish a few core metrics for which you want an exhaustive breakdown of any movement. You'll want to have at least one thing that closely captures the value your business provides. This is usually more actionable and leads any lagging changes in revenue or retention. e.g. eesel has "engaged users" which are users that access a document or use commands.
Step 3. Figure out a cadence
Establish if you're defining things at a daily, monthly, quarterly level and so on. One heuristic covered in this YC talk is to look at the frequency at which someone gets value. e.g. Airbnb measure retention at a yearly level because that's how often they expect people to make bookings.
There is no one formula, and you should use your good judgement. For instance, we think eesel's value is derived every week, but we define metrics at a monthly level because of limitations with our churn definition (which only makes sense at a monthly level).
Step 4. Breakdown what adds or subtracts
You can be as specific or abstract as it makes sense. The key thing is to explicitly introduce language to discuss the different components that move a metric. Let's look at some standard SaaS examples.
For monthly cash balance, there's:
- Revenue: $ coming in
- Burn: $ leaving
For monthly active users, there's:
- New: Users that showed up for the first time this month and are Active
- Churn: Users that were Active in the past month but not this month
- Resurrected: Users that joined before, weren't active in the past month, but are now active

For monthly recurring revenue (MRR), there's:
- New: $ that is fresh from new users who started paying this month
- Churn: $ that we were expecting to get at the start of the month but didn't, because users churned this month
- Resurrected: $ from users who had churned before but then started paying again
- Contraction: $ from users who changed plans and are paying lesser this month than before
- Expansion: $ from users who changed plans and are paying more this month than before

You can establish growth rates for each by applying the formula mentioned above.
Step 5. Introduce metrics to make connections
Establish how different metrics relate and introduce any concepts needed to make connections. For instance, in eesel, we introduced metrics to make connections between active, engaged, and paid users.

If each core metric is like a currency, these are like your conversion rates.
Step 6. Fill in any gaps
At this point, there could still be some parts of the business that aren't captured, and you should introduce concepts to cover this ground at a high level. For example, in eesel, "New active users" isn't the same as "New users" because you can sign up for eesel and never become active. So even though we already broke down "Active", we introduced another metric called "New inactive users".

Note how after this step things should feel exhaustive. You should have terms to capture all building blocks for your business. There should be no blind spots.
Step 7. Introduce a small number of calculated definitions
You may want to introduce some calculated metrics on top of your canonical metrics for simplicity. Here're some examples:
- For active users, you could define "Net Churn" as Churn - Resurrected, if the latter is pretty marginal
- For revenue, you could use Quick ratio (ratio of New + Resurrected + Expansion over Churned + Contraction)
- For cash balance, you could define "Runway left at this burn" (ratio of current cash balance over burn)
The premise is that these calculated metrics make it easier to digest and extract insights.
Wrapping up
You've now got a system of metrics in place. More importantly, you understand the need for systems oriented thinking with analytics, and how elementary concepts like Growth Accounting (along with waterfall charts) can take you pretty far.
I'd suggest reading this post by Reforge and this post by Tribe Capital to complement content we've covered. These were key to our understanding at eesel, and we're grateful for them.